I noticed that claude code released “teams” (https://code.claude.com/docs/en/agent-teams) which essentially is a multi-agent workflow that lets you define team members in your prompt and claude can just send out other instances of itself to start working. So instead of doing something reasonable like just making a quick web app I decided to do one of […]
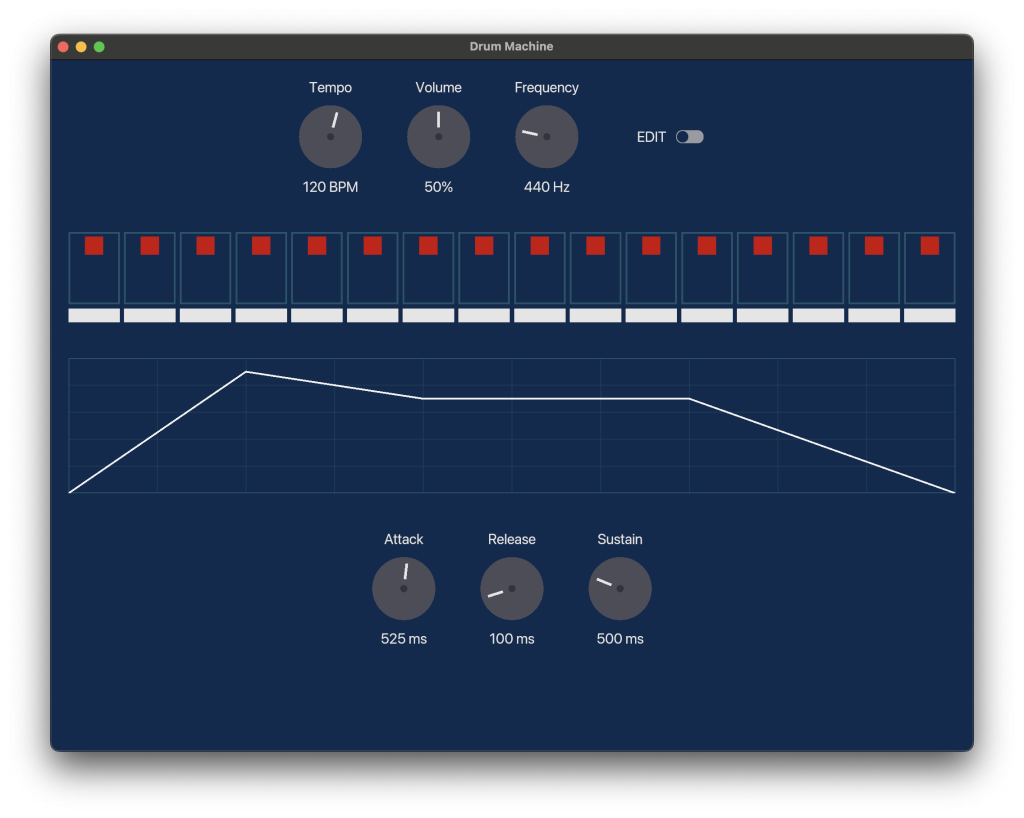
Enis sremmurd (Sine drummer)
Making moves to make a simple drum machine app: It does not look good…Gotta clean that up, make it a bit more formal looking. I very much dislike the cartoony side of things. Honestly I think the audio side shouldn’t be that difficult, it’s really just a sinewave generator with a parallel array for the […]
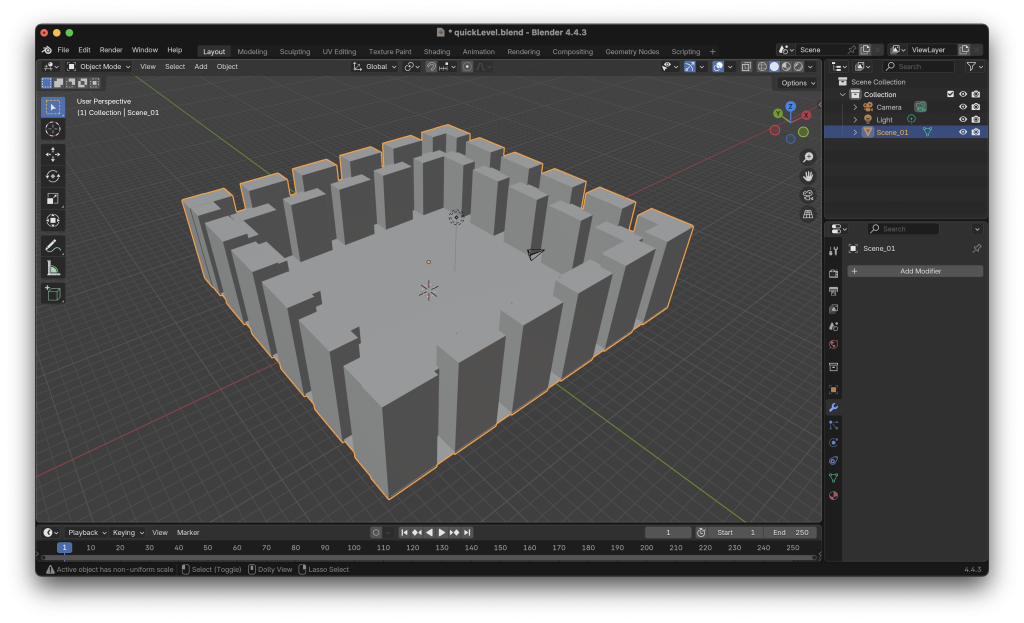
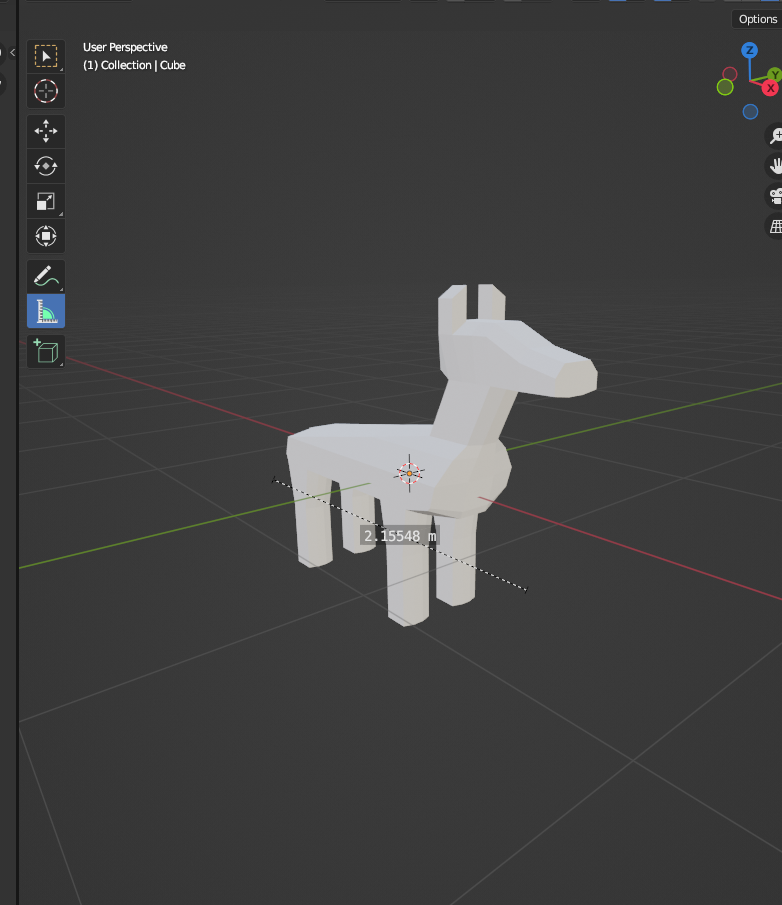
More 3D Less render
Started messing around with Bevy (https://bevy.org) which scratches some of the lower level itch I’m looking for but has enough utility things that I can spin up things kinda quick.In this case just made a first person flying camera and loaded in a scene I made in blender, rendered it red and added a light. […]
Getting better at telling AI what to do
I’ve been messing around with Claude code to see how fast I can spin up silly small projects. I also wanted to do a bit more in rust (https://rust-lang.org). The first one is a breakout clone using the egui library (they call libraries “crates” in rust to avoid sounding like python, and because the package […]
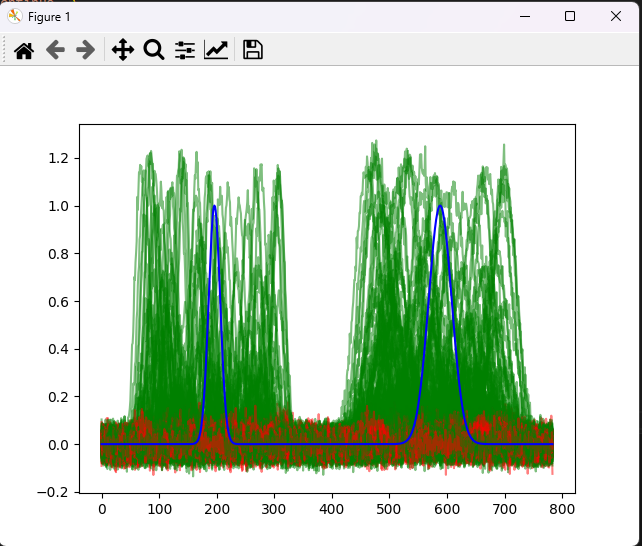
Using ML to make a well known and established DSP techniques harder (Part 2)
I got some feedback from my last post which basically said: 1.) “Why didn’t you test against different signals? “ 2.) “The signal I chose was too match against was pretty simple, you should do a continuous function” 3.) Why wouldn’t you make a subfunction to detect something like a pulse (containing something like a […]
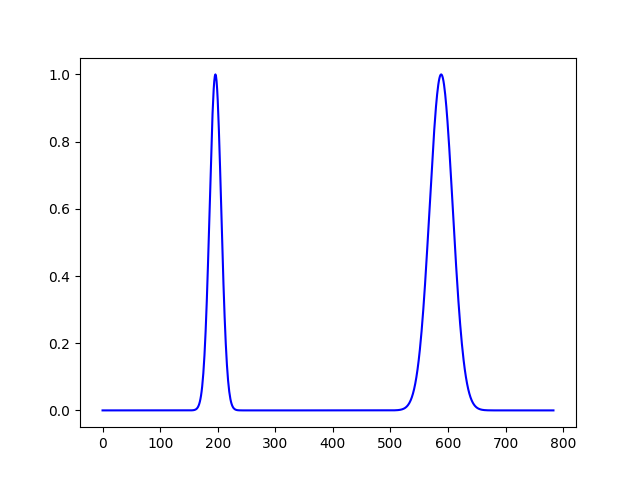
Using ML to make a well known and established DSP techniques harder
I decided to bite the bullet and startup learning pytorch(https://pytorch.org/) and basic neural net creation (Also this was a reason I dropped $2000ish on a 4090 a year ago and with the promise I could use it to do things like this). After the basic letter recognition tutorial (here) I decided I wanted to make […]

“Stay a while and Listen”
I added some visitor analytics to wordpress via a custom plugin As a non-web programmer this was surprisingly easy…Only because I have AI. Claude AI was able to throw everything into a script and threw it into a zip file and installed it into wordpress. A apart of me feels like I cheated but at […]
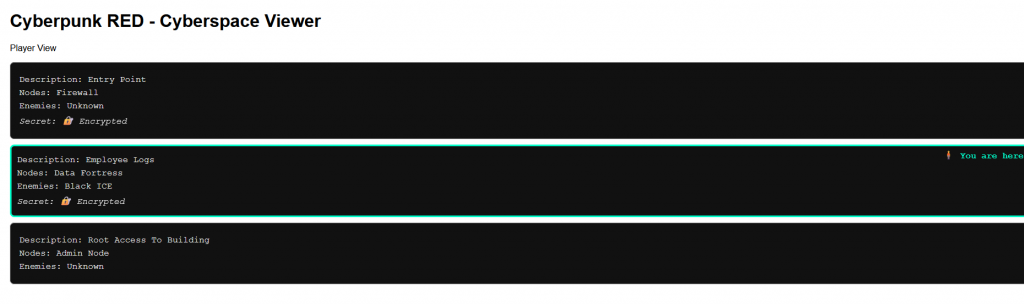
More Cyber
ChatGPT is my friend. This is in a branch:https://github.com/wfkolb/CyberpunkRedCyberspace/tree/wk_feature/NewPlayerVisualization Isn’t hooked up to firebase yet (to pull the floor information) but I figure I can make a few models to handle each level and a bunch for each of the ice daemons (you can see the dog for the hellhound: https://cyberpunk.fandom.com/wiki/Hellhound_(RED) ) which I’ll probably […]
Vibin’ for some cyberpunk
Did a bit more work on the cyberpunk stuff Functionally I think I’m close. I’m probably not going to add branching paths to the floors but I’d rather get this locked down then I can transition the viewing to a better 3d model view (with elevator and all). Code is posted here: https://github.com/wfkolb/CyberpunkRedCyberspace Again this […]

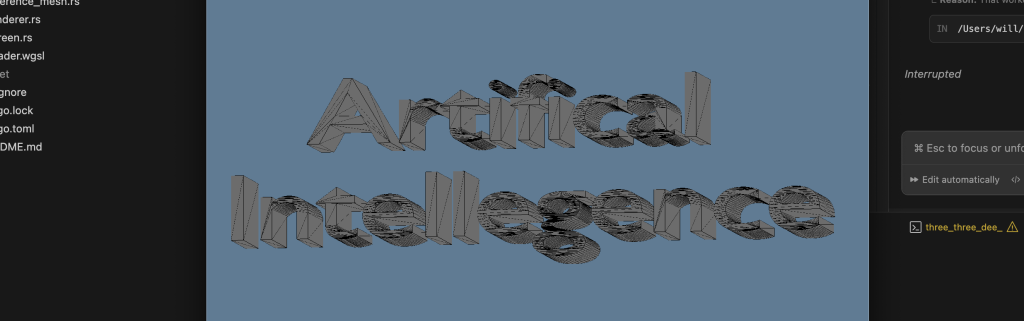
More Vibe coding
I wanted to setup a way to visualize the cyberspace for cyberpunk red ( https://www.cbr.com/cyberpunk-red-netrunner-class-explained/ ) for awhile and I never found a good solution. So I tried spinning up my own version with some chatgpt help: Looks like crap but if I get a simple viewer working it should be easy enough to get […]